
You see a symptom (no new measurement data, an update keeps failing) and want to know which service of the edge is responsible.
Steps
-
Top-right cog → Settings → Diagnosis in the sidebar.
-
The list shows every edge service of your device (such as
main-ui,datastore,postgres,update-serviceand — depending on the equipment —grafana,idea4sbridge,iolink-proxy,mosquitto,usb-service,flecs) — each with a status dot and an N messages drawer: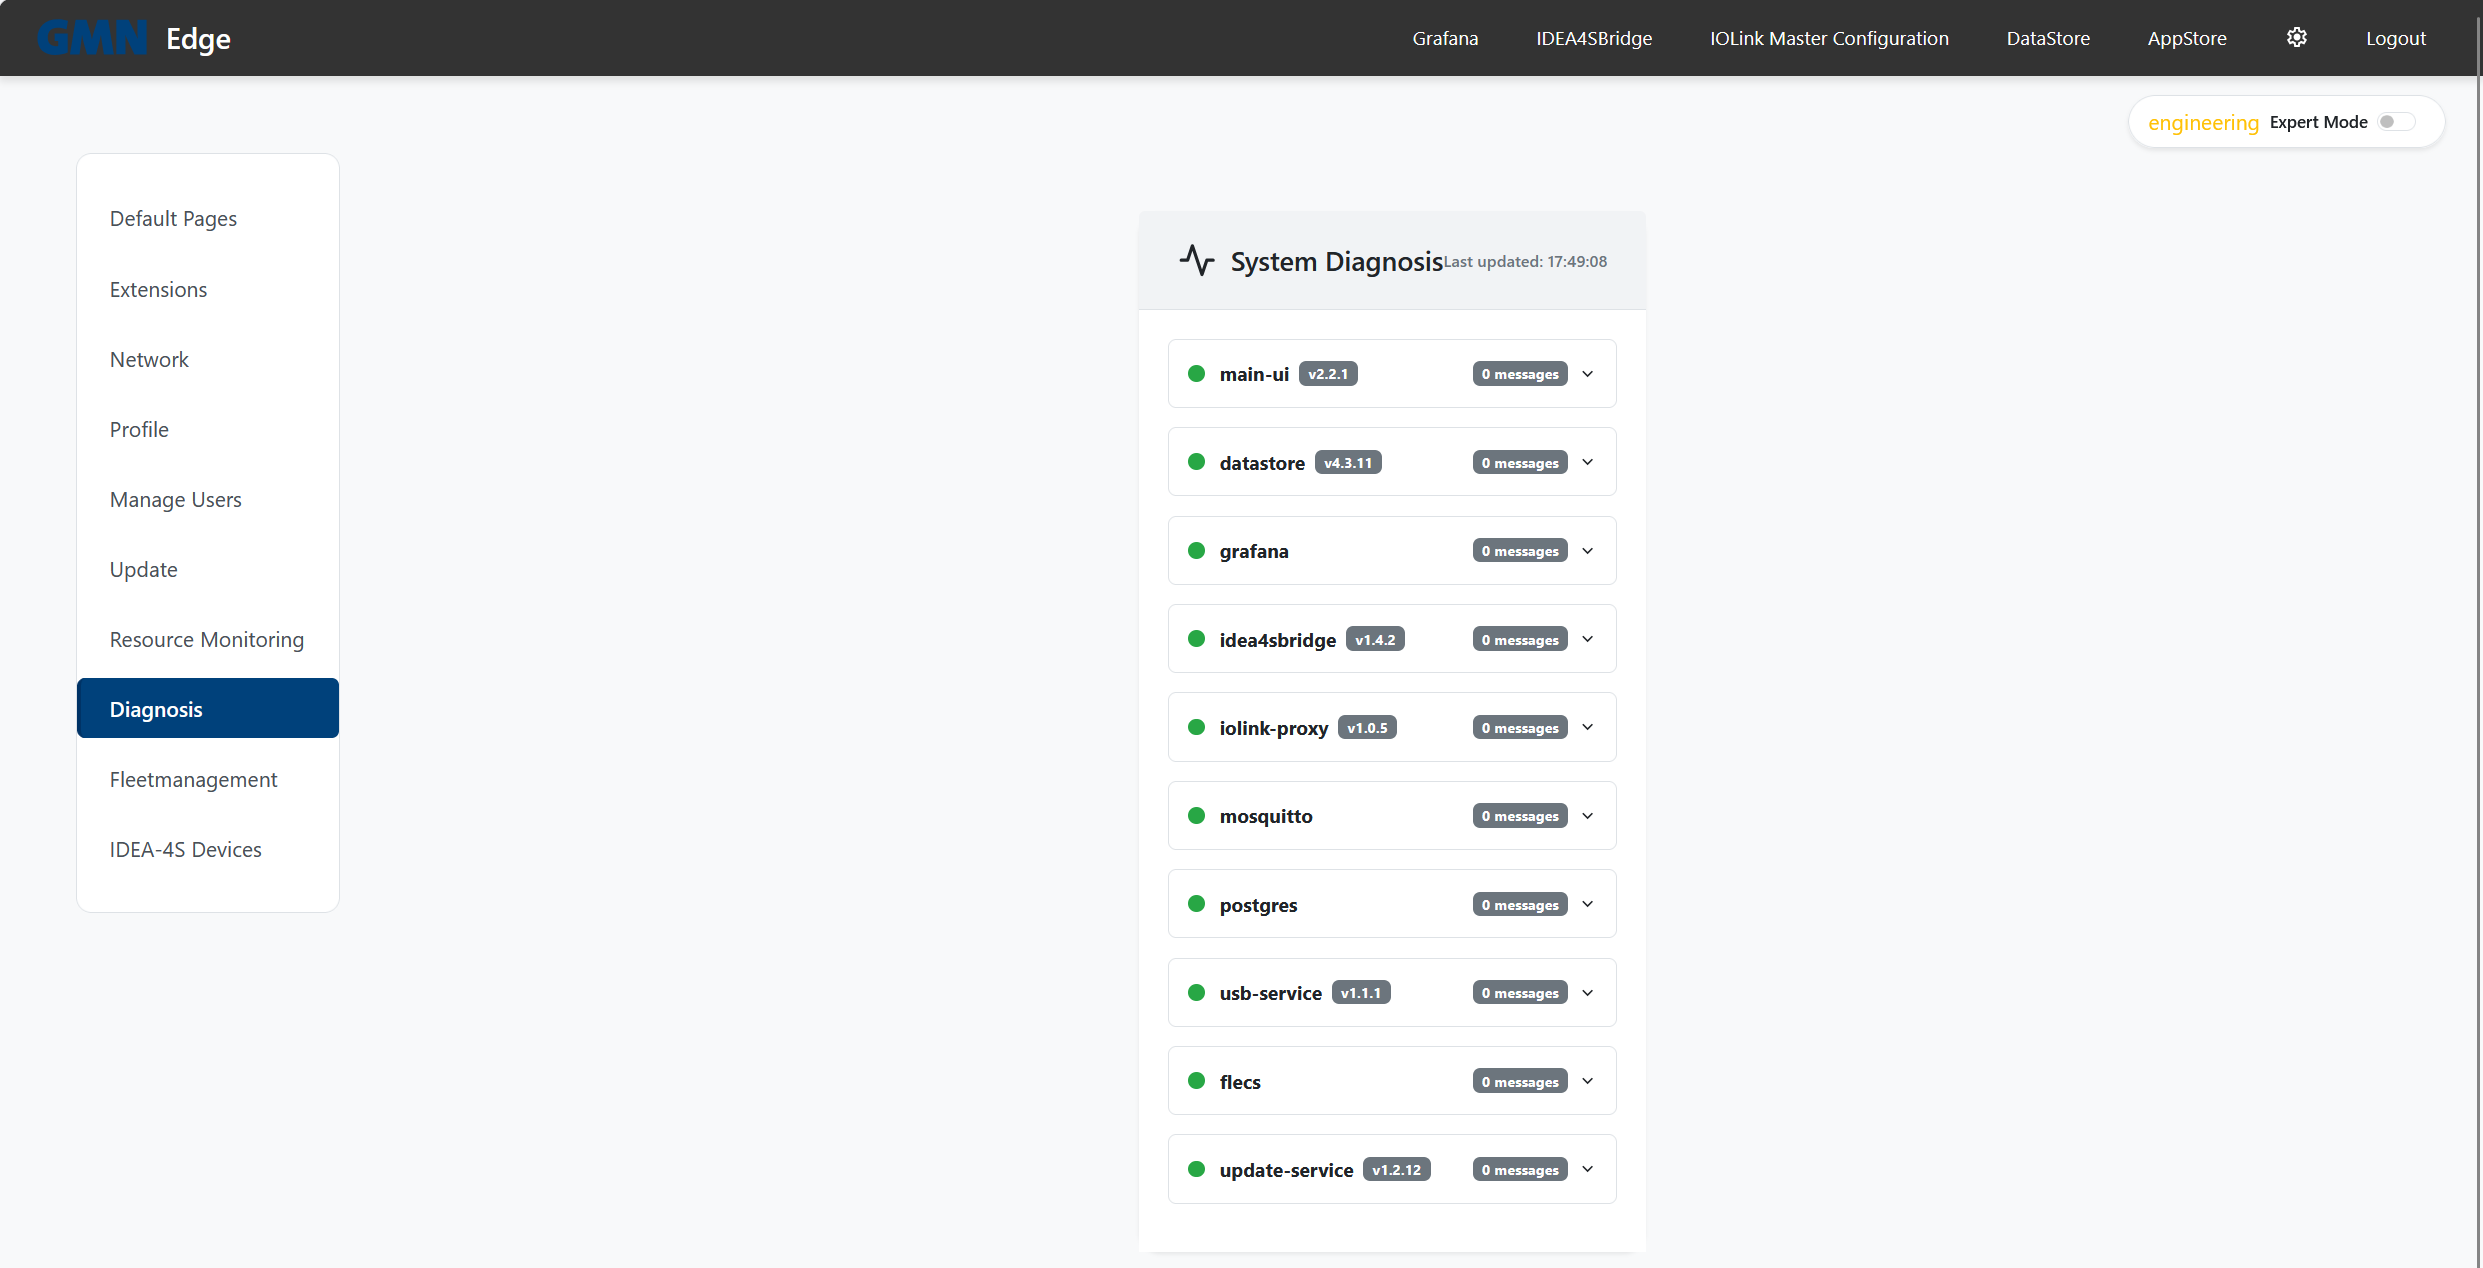
-
Read the status:
- 🟢 green → no open messages, the service considers itself healthy.
- 🟡 yellow → at least one warning. Service still runs, but something is off.
- 🔴 red → at least one error. Service may be degraded or failed.
-
For any non-green dot expand the N messages drawer — individual messages appear with their code and an explanation.
-
Look the code up in the Diagnosis codes table — it explains the meaning and the typical action.
Common patterns
update-servicered shortly after an update: the update was rolled back — the previous state is running again; see Diagnosis codes 2xxx.
If you’re stuck
Send the hotline the machine ID, the symptom and the codes shown, most easily as a screenshot of the diagnosis page.